blueye.sdk
![]()
![]()

![]()


Read Latest Documentation - Browse GitHub Code Repository
Note: This is a pre-release -- Please report any issues you might encounter
A Python package for remote control of the Blueye Pioneer and Blueye Pro underwater drones.

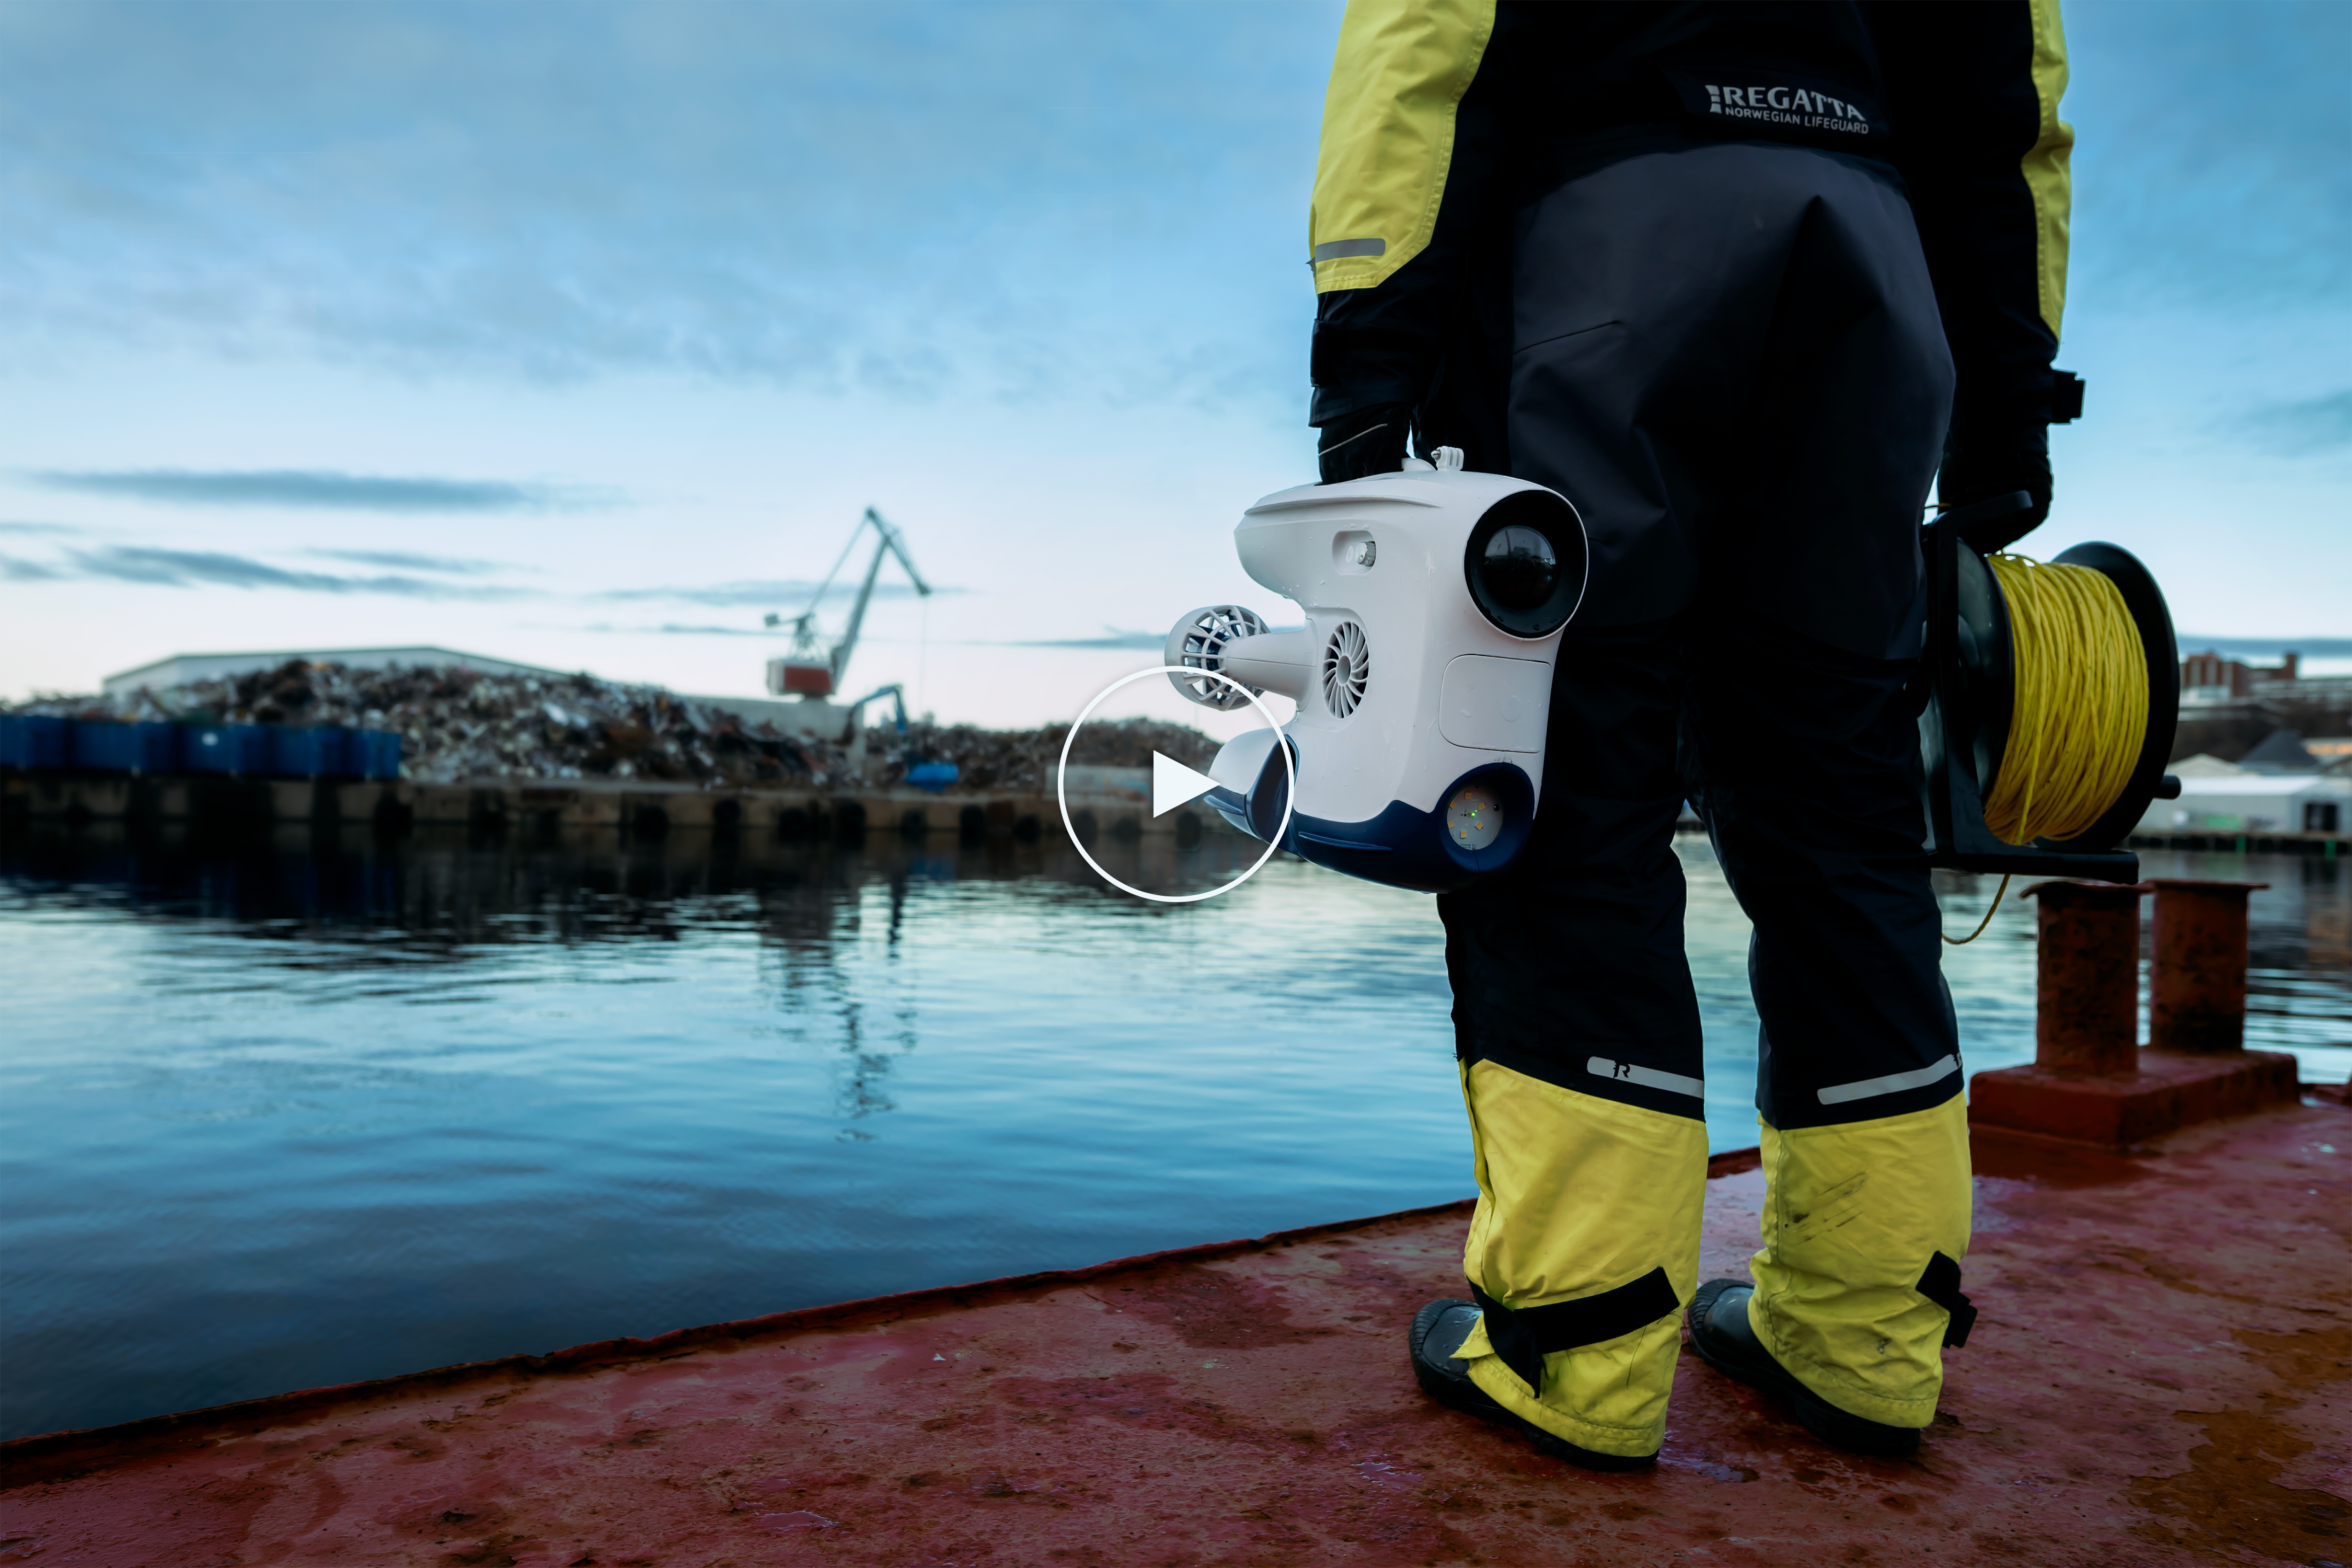
About Blueye Underwater Drones
The Blueye Pioneer and Blueye Pro are underwater drones designed for inspections. It is produced and sold by the Norwegian company Blueye Robotics.
Here is a Youtube video that gives a overview of the system and its specifications.
This SDK and the Blueye drones
A Blueye drone is normally controlled via a mobile device through the Blueye App (iOS/Android). The mobile device is connected via Wi-Fi to a surface unit, and the Pioneer or Pro is connected to the surface unit via a tether cable.
This python SDK exposes the functionality of the Blueye app through a Python object. The SDK enables remote control of the Blueye Pioneer and Blueye Pro as well as reading telemetry data and viewing video streams. It is not meant for executing code on the Pioneer. To control the drone you connect your laptop to the surface unit Wi-Fi and run code that interfaces with the Blueye Pro or Blueye Pioneer through the Pioneer Python object.
Check out the Quick Start Guide to get started with using the SDK.